Category Archives: Identity-by-descent

DRUID accuracy plot

Estimating relationships by combining DNA from multiple siblings – DRUID

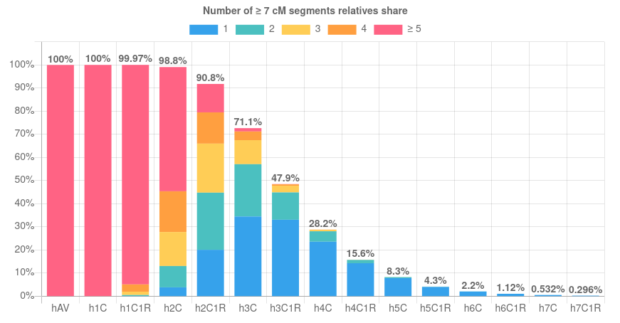
When trying to use DNA to figure out how two people are related, the closer their relationship, the easier it is. This is clear in the image below, which is from a paper that shows the rates that relatives of different degrees get classified to each of four different degrees.11st degree relatives include parent-child and full siblings, 2nd degree relatives include grandparent-grandchild, half-sibling and aunt/uncle-niece/nephew pairs. There are more types of 3rd degree and 4th degree relatives, but as an example, first cousins are 3rd degree relatives and first cousins once removed are 4th degree relatives. Genetic testing companies typically don’t try to report exact degrees of relationships for relatives because, as the image shows, it’s easy to get the answer wrong (and things get even less reliable for more distant relatives than these). However, plenty of genealogists use cM sharing numbers (and the shared cM project) to try to pinpoint how two people are related.

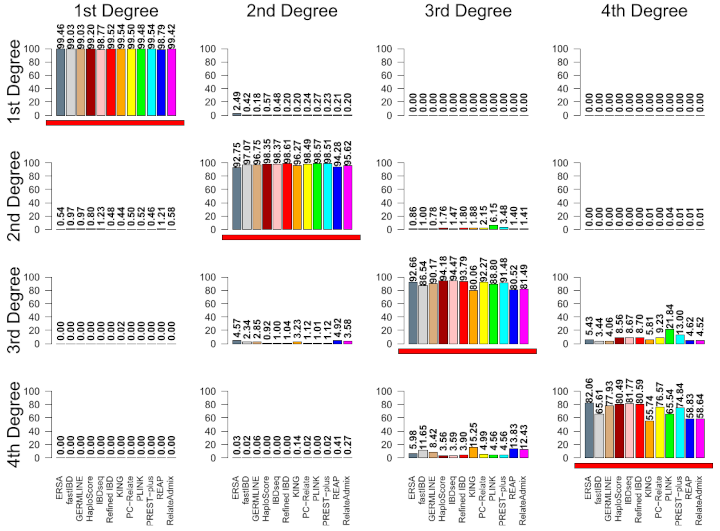
Part of a figure from a paper that calculated the accuracy of 12 relatedness classifiers. The true relationship is given on the horizontal (in each column) and the vertical (rows) gives the detected relationship from each of the 12 tools.

This post is about a new tool called DRUID for using segments that two or more siblings share with a relative to improve the determination of their relationship. Ideally we would all test our parents’ DNA (or, if possible, their parents’ DNA), since our parents are one generation closer to our non-descendant relatives than we are.2Our parents are one generation more distant than we are to our descendants: children, grandchildren, etc. This means that our parents are one degree of relatedness closer to our relatives, which makes for more reliable classification (as shown in the image above). If you do test your parents, consider testing their siblings as well since that gets you a larger portion of your grandparents’ DNA. The more siblings (including half-siblings) tested, the more of their parent’s DNA you have access to. On average two siblings inherit 75% of their parent’s DNA, three siblings inherit 87.5%, and |S| siblings inherit an average fraction of 1 – ½|S| of their parent’s DNA.

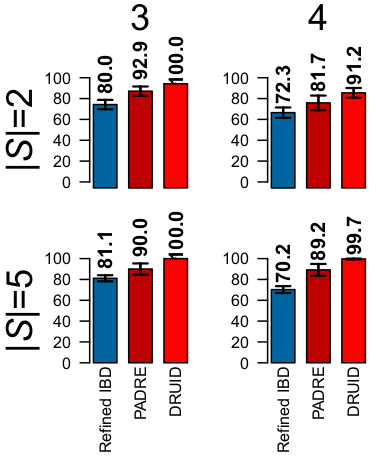
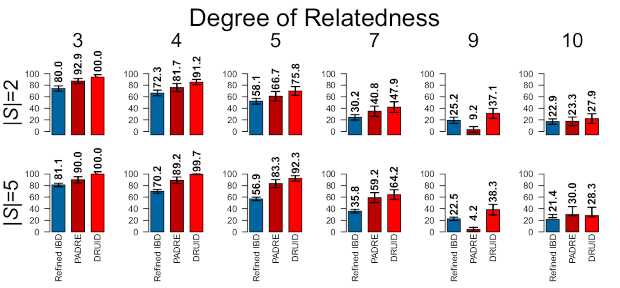
Before going into the way DRUID works, the image below shows how much DRUID can improve relationship detection.3This image is based on simulated relatives, but DRUID similarly improves real relatives. The first row of results is for two siblings, |S| = 2; the second row is for five siblings, |S| = 5; and the columns give the true degree of relationship. The bars to compare are those of Refined IBD, which analyzes each sibling independently, and DRUID (PADRE combines information but does so differently than DRUID). As an example, for 3rd degree relatives, DRUID detects 100% of the relatives correctly compared to 80% using the method that only analyzes pairs of relatives. For 5th degree relatives, DRUID detects almost 76% correctly compared to 58.1% on average when analyzing the siblings separately.

DRUID uses the same information as Refined IBD but instead of comparing each sibling to the relative independently, it combines IBD segments from the siblings to improve accuracy. This figure is from the paper that describes DRUID.

DRUID combines segments that sibligs share with a relative to detect the parent's shared cM

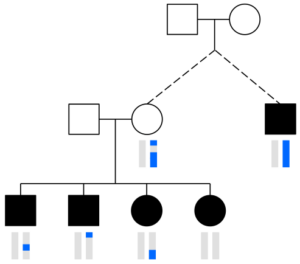
DRUID merges the segments that two or more siblings share with a relative to determine how many cMs their parent shares with that person. In this image, the distant relative (black square on the right) has one blue chromosome (blue vertical bar below) and the blue regions in the sibling’s chromosomes are segments each shares with the distant relative (siblings are the black squares and circles on the bottom left, and their chromosomes are vertical bars below each shape). DRUID assumes these segments all come from one of the parents (here, the unfilled circle above the siblings; the blue regions in the vertical bars below this circle indicate the parent’s shared segments with the relative).

Briefly, the way DRUID works is that it assumes that all segments the siblings share with the relative come from only one parent and it combines those segments together (see the image on the right). It then calculates an estimate of how much of the parent’s DNA the siblings have represented using the (1 – ½|S|) formula. DRUID assumes that this is the fraction of parent’s total cMs the siblings have inherited. So if the siblings have X cM shared with the relative, DRUID calculates T, the estimated total cM the parent shares, as T = X/F where F = 1 – ½|S|. As the image above and several other tests from the DRUID paper show, this approach improves relationship classification.

Please don’t use DRUID if your ancestry includes endogamy or if your parents are somewhat closely related to each other. In those cases, the segments the siblings share with the relative may be a mix of DNA from both parents, and DRUID will overestimate how many cMs one parent shares with the relative.

We hope you find DRUID useful and note that the effort to get this online was a collaboration with Jonny Perl who is also launching a DRUID tool.

Thanks to Monica Ramstetter who spent many hours co-developing DRUID and calculating the accuracy of academic methods for detecting relatives (a portion of which are shown in the first image above).

Amy WilliamsAmy Williams is a Senior Scientist at 23andMe working on the population genetics research & development team. Prior to joining 23andMe in 2022, she was an associate professor of Computational Biology at Cornell University. The opinions and tools on this website are strictly those of the author.
Posted in Estimating relationships, Identity-by-descent on . Leave a comment
Slider image

IBD sharing rates across length thresholds

Some time ago, we received a request in response to our sharing rate plots for relatives with ≥ 7 cM segments to also plot rates for ≥ 5 cM segments. Instead of just calculating the rates for one more threshold, it seemed good to include several different lengths. Thus we now have a IBD sharing rates tool that allows a user to select from seven different length thresholds that range from ≥ 0 cM to ≥ 20 cM.

In other news, we have been working on extending HAPI to reconstruct the X chromosome, and the results so far are quite good! Stay tuned for updates—we will email the mailing list when this is online. (See the subscription box below.)

Thanks to Belinda Dettmann for asking about sharing rates for ≥ 5 cM segments and to Leah Larkin for asking for rates using longer segments.

Amy WilliamsAmy Williams is a Senior Scientist at 23andMe working on the population genetics research & development team. Prior to joining 23andMe in 2022, she was an associate professor of Computational Biology at Cornell University. The opinions and tools on this website are strictly those of the author.
Posted in Identity-by-descent on . Leave a comment
Rates of half relatives sharing ≥ 7 cM segments

How often do two half relatives share DNA?

Following up on the last post about full relatives, the plot below shows the rates that half relatives share ≥ 7 cM IBD segments. This uses the same abbreviations as in the previous post—1C means first cousins, 3C1R stands for third cousins once removed—but all relationships are prefixed with an `h’ for half. The first relationship, hAV, is half-aunt/uncle-niece/nephew. Papers often refer to aunt/uncle and niece/nephew relatives as “avuncular,” so the plot uses AV as an abbreviation.

Your browser does not support the HTML5 canvas tag.

The rates are very similar to the “roughly” equivalent full relatives from before (see the table of equivalent relationships), but are a bit lower here. For example, half-third cousins (h3C) share at least one ≥ 7 cM segment in 71.1% of pairs versus the rate in third cousins once removed (3C1R—a roughly equivalent full relationship) of 72.7%.

Details of the simulation are the same as in the last post. This includes using the same number of pairs (100,000) for each relationship type.

Some have asked about rates for different minimum segment lengths. This is perhaps best to represent in a tool, and we’ll work on getting one up in the coming weeks.

Amy WilliamsAmy Williams is a Senior Scientist at 23andMe working on the population genetics research & development team. Prior to joining 23andMe in 2022, she was an associate professor of Computational Biology at Cornell University. The opinions and tools on this website are strictly those of the author.
Posted in Identity-by-descent on . Leave a comment
Rates of relatives sharing ≥ 7 cM segments

How often do two relatives share DNA?

Close relatives like two full siblings, an aunt and nephew, or a grandparent and grandchild always share IBD segments, so they show up in testing companies’ relative matches. However, more distant relatives may not share any IBD segments. In fact, the chance that two people share DNA decreases with the distance of their relationship. This is important to remember when doing genetic genealogy: if you don’t share segments with someone that doesn’t necessarily mean you’re not related to them. As the numbers below show, even some rare second cousins (0.02% based on this analysis) may not have any detected IBD segments.

To find out the rates that relatives share segments, one option is to simulate. We did this previously (Figure 3, the SS+intf bars), but that work counted all segments, regardless of their length. Unfortunately, reliably detecting segments shorter than 6-7 cM is hard and most companies only look for 6 or 7 cM or longer segments.

Considering only 7 cM or longer segments changes the rates that relatives share DNA, as shown in the plot below. The numbers above each bar give the percent of each relative type that share at least one ≥ 7 cM segment. (Here 1C represents first cousins, 2C second cousins, etc., and NC1R represents Nth cousins once removed.) From this, we see that first cousins share five or more ≥ 7 cM segments 100% of the time, while only 0.286% of eighth cousins share such a segment (and nearly all share only one). (See below for details on how we simulated.)

You can hover over the bars to see the percentage breakdowns across segment counts.

Your browser does not support the HTML5 canvas tag.

These numbers are from simulated relatives: 100,000 pairs for each type. If the segment is present, the simulator always reports it. A caveat therefore is that, while companies report many of the ≥ 7 cM segments, they sometimes miss some. (They also sometimes report a segment that is not real, unfortunately, though in most cases a ≥ 7 cM segment will be real.) Therefore, these numbers should be used as a guide. We could—and a future blog post may—update the numbers based on probabilities of detecting segments, but a challenge is that detection rates depend on many factors, including how many SNPs were tested in the two relatives and the method the companies use to detect the segments.

Other relative types


The simulations considered a range of full cousins and full cousins once removed. It turns out, a full Nth cousin has the same shared segment properties as a full (N-1)th cousin twice removed, so the sharing rates here apply to many more types of relatives. Specific examples of equivalent relatives are shown below along with general cases. (This table doesn’t list all relative types.)

Relationship Equivalent
relationships
Roughly equivalent
relationships
1C great-aunt/uncle half-aunt/uncle
1C1R 2nd great-aunt/uncle half-1C
2C 1C2R half-1C1R
2C1R 1C3R half-2C, half-1C2R
3C 2C2R, 1C4R half-2C1R, half-1C3R
3C1R 2C3R, 1C5R half-3C, half-2C2R, …
4C 3C2R, 2C4R, 1C6R half-3C1R, half-2C3R, …
4C1R 3C3R, 2C5R, 1C7R half-4C, half-3C2R, …
NC (N-1)C2R, (N-2)C4R, (N-3)C6R, … half-(N-1)C1R, half-(N-2)C3R, …
NC1R (N-1)C3R, (N-2)C5R, (N-3)C7R, … half-NC, half-NC2R, …

Half relatives such as half-first cousins (who share one common grandparent instead of two as in full first cousins) have very slightly lower rates of sharing segments than full relatives of the roughly equivalent type. If there’s enough interest (on Twitter or in the comments), we can put up another post on half-relatives. Update: See the next post for rates in half relatives.

Simulation details

The numbers in the plot above are based output from the Ped-sim program where we used a sex-specific genetic map and modeled crossover interference. We found that Ped-sim very accurately captures the total segment length that real relatives share, so the numbers in the plot should be very reliable in a scenario where a company detects all ≥ 7 cM segments with no false segments. You can run Ped-sim with sex-specific maps and interference here.

Thanks to Jonny Perl for asking about sharing rates of 4C2R, which helped motivate this post.

Amy WilliamsAmy Williams is a Senior Scientist at 23andMe working on the population genetics research & development team. Prior to joining 23andMe in 2022, she was an associate professor of Computational Biology at Cornell University. The opinions and tools on this website are strictly those of the author.
Posted in Identity-by-descent on . 16 Comments