In our first blog post on what is a centiMorgan?, we talked about genetic maps. Many of the planned tools at HAPI-DNA (and all of the current ones) use genetic maps to calculate lengths of segments or to simulate segments. One of the most commonly used genetic maps (the HapMap map) contains nearly 3.4 million entries. When doing web-based analyses like those we feature here, it’s good to reduce the number of map entries. This post talks about how to drop sites from a genetic map without dramatically reducing its usefulness. Using the tool we produced for this reduces the HapMap map to just over 32,000 entries (a >100-fold reduction!). We might call this a minimal genetic map. (The title of this post is inspired by minimal viable genomes.)
Readers primarily interested in genetic genealogy may find this post a bit less useful than others. More posts about segment sharing among relatives are in the works.
Genetic maps only give a limited number of entries—not one for all >3 billion base-pairs in the human genome. Therefore, finding a genetic position for a physical position that’s not directly included in a map typically involves interpolation. A map entry lists a physical position and its corresponding genetic position, usually in centiMorgans (cM). Most IBD segments won’t have physical start and end positions listed in the map, so the standard approach is to linearly interpolate using the map positions before and after to find the genetic positions. For example, if the genetic map lists physical position 1,000,000 as being at genetic position 1.0 cM, and if the next physical position in the map is 1,200,000 at 1.2 cM, we could linearly interpolate to get the location of physical position 1,100,000. That physical position is halfway between the two flanking physical positions in the map, so its genetic position would be 1.1 cM—halfway between the two flanking genetic positions.

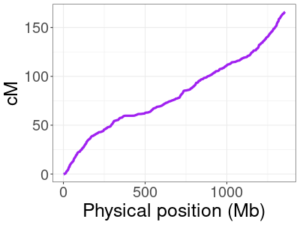
HapMap genetic map for human chromosome 10.
Genetic maps do not always change in a linear way between positions. This means that, if we drop entries in our genetic map arbitrarily, linear interpolation could end up giving cM positions that are far off from their true values. The image here plots the HapMap map for chromosome 10, with physical positions on the x-axis and the corresponding genetic (cM) position on the y-axis. The relationship is not linear (a zoomed in view in a smaller region would make this even more obvious), so we can’t drop positions without some care.
Instead of arbitrarily dropping map entries, the (non-web-based) tool for reducing genetic maps only drops positions where, if that location were to be linearly interpolated from the flanking locations, the difference (error) to the original map would be less than 0.05 cM. This is a tiny difference and should not meaningfully impact nearly any analysis we might want to do with IBD segments. The details of how this tool works are beyond our scope, but in general it scans a set of positions until it finds one that has minimum linear interpolation error (below 0.05 cM) and drops that entry. Following this, the tool restarts its scan to find the next entry with minimal error and drops this if it can, repeating the process until any remaining entries would produce more than 0.05 cM of error if they were linearly interpolated from their two flanking positions.
A map with only 32,143 entries, as this minimal map has, is great for the WebAssembly tools hosted on HAPI-DNA. WebAssembly tools run on the viewer’s computer—on your computer. The map is stored in only roughly 251 KB (with a four byte integer for the physical position and four byte floating point number for the cM position for each entry). The original sex-specific genetic map used for web-based simulating contains 833,777 entries, but after removing positions that can be interpolated with ≤ 0.05 cM error, it contains only 43,128 entries. With two cM positions per site—one male and one female—this map fits in 518 KB of memory.
If there is interest in comments or on Twitter, we’ll post the WebAssembly code for the segment length tool.
Thanks to Jonny Perl for collaborating on the idea of having a web-based cM calculator.
Nice work Amy. When I was testing the hapmap maps. I used a very simple method to see which condensed version was still functional. I created several condensed maps and using MyHeritage/23andme segment data I re-calculated the cM values for each of the segments. Next, I compared them with the original cM values as reported by MyHeritage/23andme and kept track of the difference. I could then quickly see what the effect of a certain condensation factor was.
I have just been pointed to your site by Debbie Kennett, who thought – correctly – that it might enable me to map marker locations to cM. I have a question.
In your blog you say “Instead of arbitrarily dropping map entries, the (non-web-based) tool for reducing genetic maps only drops positions where …..”. Does this imply that your web-based tool does not employ this technique, and is therefore more error-prone? If so, would you recommend that someone with minimal programming skills should use the app instead? Thanks.
Good question! The tool for reducing the genetic maps needs only to be run once. The web-based tool then uses this “minimal viable” map, so it’ll give you cM positions that are quite reliable. The non-web-based tool is actually only intended to operate on a map, not for looking up marker locations.